

The latest vr industry trends for B2B business are not about better headsets — they are about better business models. For commercial venue operators — shopping-mall FECs, amusement parks, Urban Entertainment Hubs, and VR arcades — the technology that matters in 2026 is the technology that converts floor space into repeatable revenue. This article breaks down the five trends that should shape your next procurement decision, backs them with real operational data from a working LEKE VR flagship store, and gives you a reference model to evaluate virtual reality b2b investment returns before you commit a dollar.
Below, we map the vr industry trends into five concrete technology directions, translate each into its commercial implication, then close with a vr market analysis that connects industry sizing to your venue’s P&L. Everything here is written from the operator’s perspective — because in commercial VR, a trend you cannot monetize is just a press release.
About This Analysis
This trend analysis is based on 12 years of commercial VR manufacturing and deployment, live operational data from LEKE VR’s 700+ partner venues across 40+ countries, and the company’s own flagship store in Changsha — a real shopping-mall VR venue operating since May 2026. Market references are drawn from publicly available industry research. The five trends below are selected for their direct impact on B2B venue economics, not for novelty. This article is not paid content, and no technology vendor is promoted beyond LEKE VR’s own equipment ecosystem.
The 5 VR Industry Trends That Matter to B2B Buyers in 2026
Five technology directions are reshaping how commercial VR venues generate revenue. Each is a vr industry trend with a clear economic rationale — here is the summary, followed by a detailed breakdown of each.
Trackless MR karting and mixed-reality simulators turn physical motion into premium-priced, high-repeat experiences — the strongest spectator draw in the format.
Untethered arenas supporting 1-20+ players convert group bookings, team-building events, and birthdays into the venue’s highest per-session revenue.
A 700+ title library with a structured update pipeline keeps content fresh — the #1 driver of customer return, not hardware specs.
AI-driven NPCs fill off-peak sessions, while smart operations tools improve staffing and maintenance scheduling — cutting cost and boosting yield.
High-throughput 9D cinema pods capture walk-in family traffic with zero skill barrier — the volume engine that sustains weekday baseline revenue.
Trend 1 — Mixed Reality Merges Physical Motion with Digital Worlds
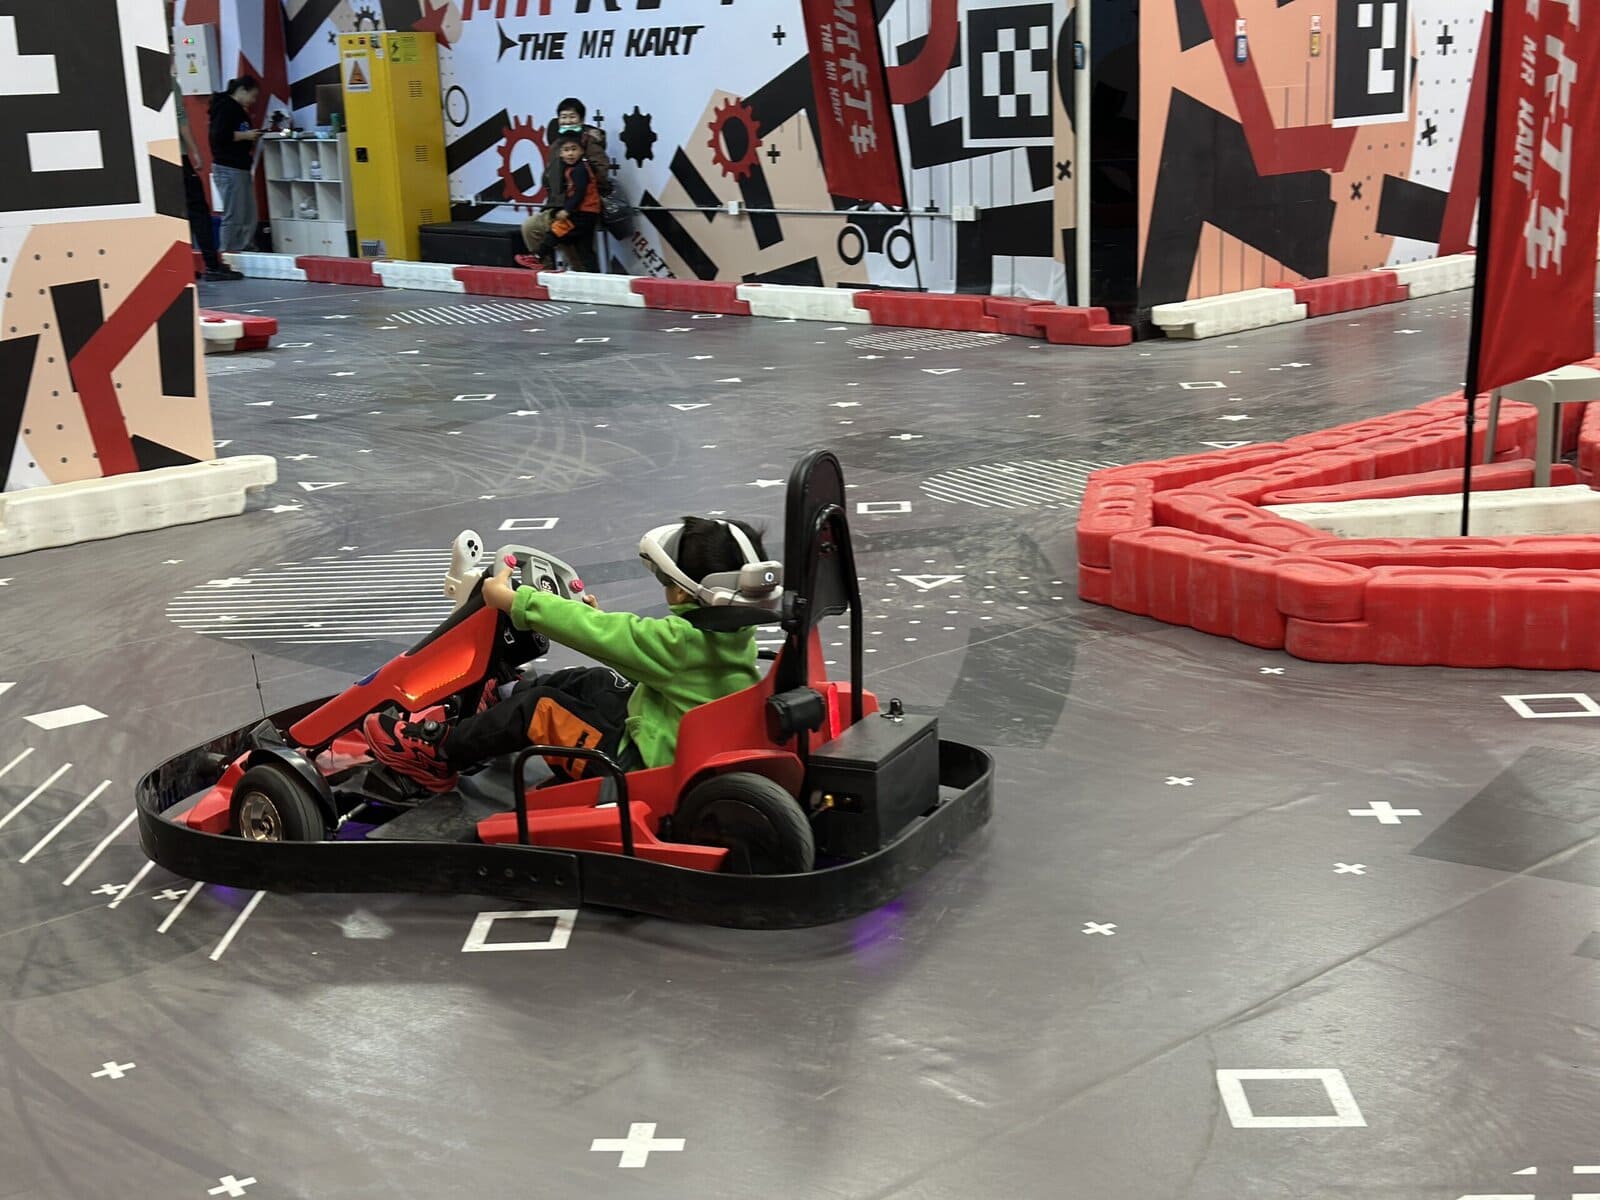
The most commercially significant vr industry trend of 2026 is the shift from headset-only VR to mixed-reality experiences that put the player’s whole body in motion. Trackless MR karting is the flagship example: the player drives a real, battery-powered kart through real space while a digital world is overlaid through the headset. The result engages the vestibular system (real motion), the visual system (MR rendering), and the proprioceptive system (hands on a real wheel) simultaneously — producing the highest post-session satisfaction scores in the format.
For the B2B buyer, the economic case is decisive: physical karts in motion are the strongest spectator draw in commercial VR, generating organic social media content and pulling walk-in traffic. In LEKE VR’s Changsha flagship store, the MR Go-Kart ranks among the top attractions by play count — a real-world validation of this virtual reality b2b investment direction.
Trend 2 — Social Free-Roam Multiplayer Becomes the Group Attraction
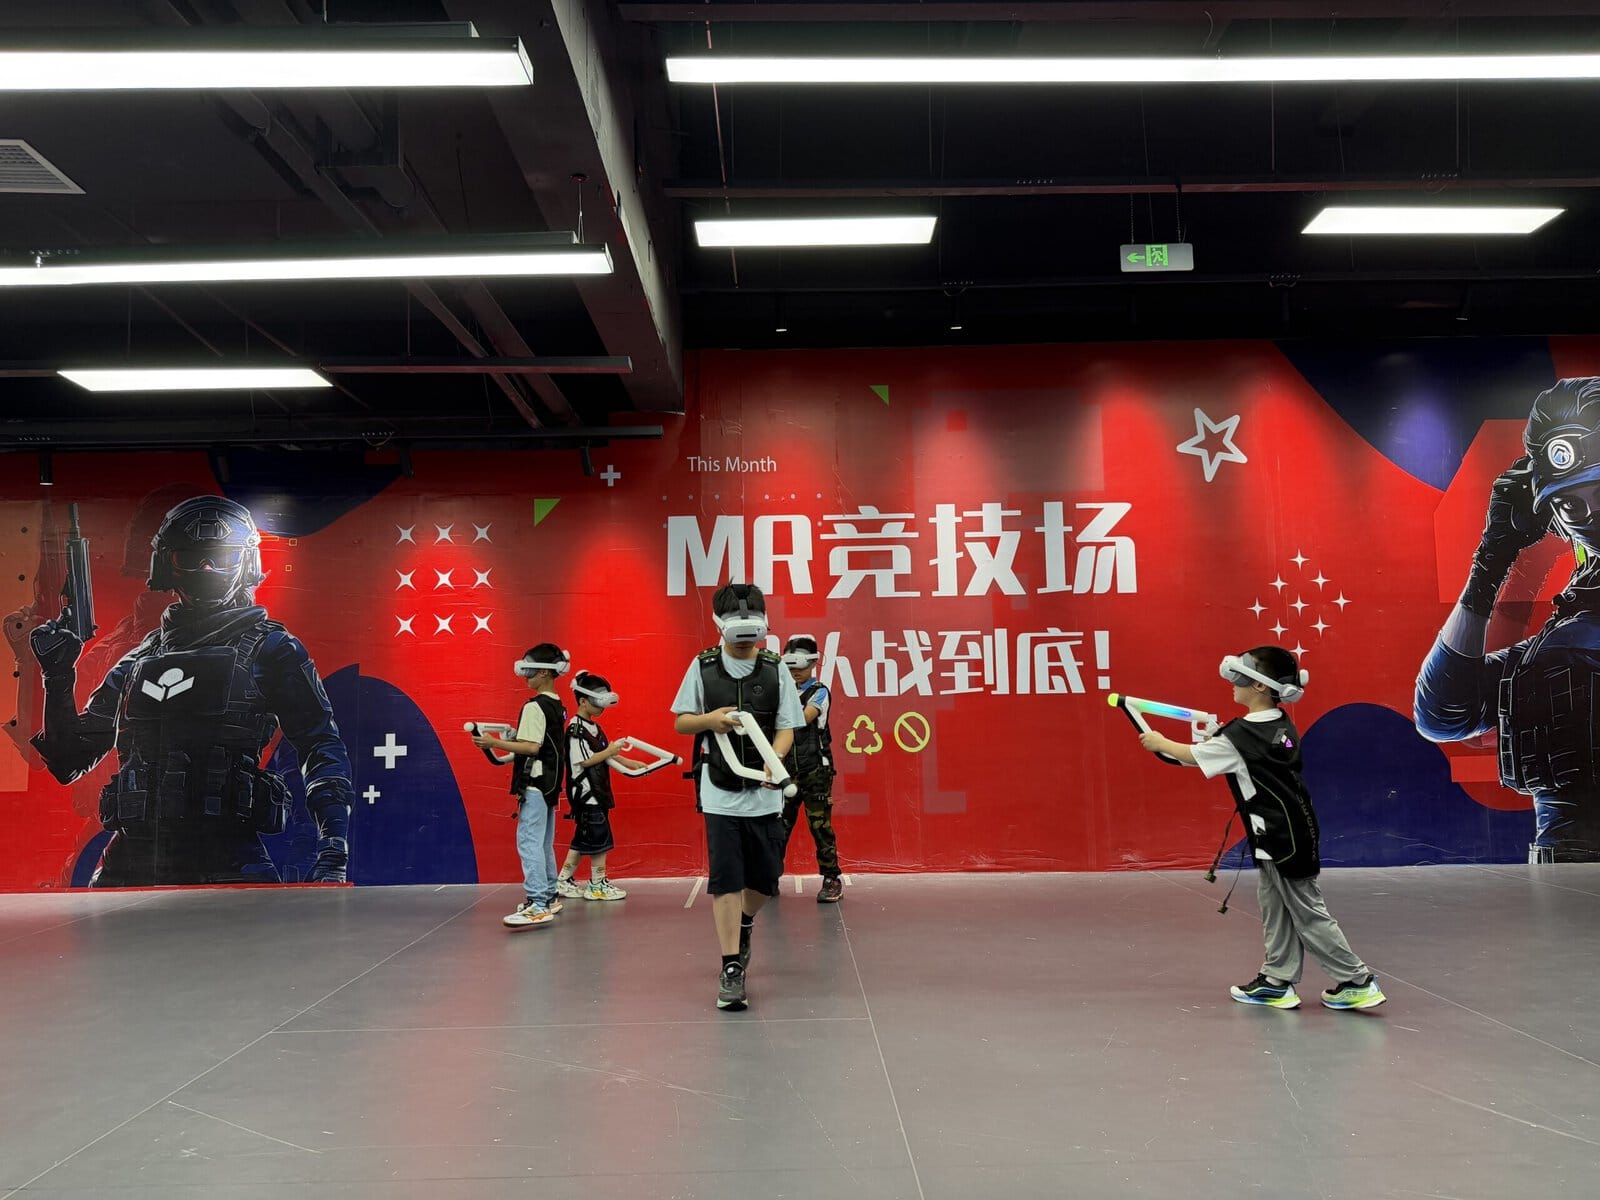
A second defining vr industry trend is the rise of untethered, free-roam multiplayer arenas as the venue’s group-revenue anchor. Unlike solo experiences, an arena supports 1 to 20+ simultaneous players in a single booking slot — multiplying per-session revenue by group size while staffing stays roughly constant. Group bookings, corporate team-building, birthdays, and e-sports-style weekend tournaments all land on this format.
The X-Space VR Arena exemplifies the trend: a software-defined arena with millimeter-level spatial positioning and enterprise-grade headsets, shipping with a curated 18-title premium configuration. In the Changsha store, this category consistently delivers the highest per-session ticket prices and longest dwell times — the primary revenue engine behind weekend and holiday surges.
Trend 3 — Content-as-a-Service Drives Repeat Visitation
Hardware without a content plan is a static box. The third vr industry trend is the professionalization of content delivery: operators no longer buy a machine and a handful of games — they buy a continuously refreshed content pipeline. LEKE VR’s 700+ title back-catalog and structured release schedule mean the venue’s library grows after purchase, keeping the experience fresh and driving repeat visitation.
Industry data consistently shows multiplayer and freshly-updated content generate 2-3x higher repeat visitation rates than static solo experiences. For the B2B operator, content freshness is not a feature — it is the difference between a venue customers revisit and a venue they’ve “already seen.” This is explored in depth in our analysis of why demand for VR experiences is growing and how immersive VR hardware and content layers work together.
Trend 4 — AI Enhances Both the Experience and the Operation
Artificial intelligence is quietly becoming one of the most practical vr industry trends for operators. On the experience side, AI-driven NPC opponents fill solo and off-peak sessions that would otherwise sit idle — turning dead weekday hours into playable revenue. On the operations side, AI-assisted analytics improve staffing schedules, maintenance prediction, and content-performance decisions.
For LEKE VR, AI NPC racers and opponents are built into flagship products to sustain replay value across off-peak hours — a structural answer to the classic B2B problem of weekday under-utilization. When evaluating suppliers, ask specifically how their AI features convert non-peak time into revenue; a “smart” claim without an operational answer is marketing.
Trend 5 — Premium Cinema and Specialized Immersion Expand the Venue Mix
The fifth vr industry trend is the strategic return of high-throughput, skill-free attractions. Premium 9D cinema pods like the Space Shuttle 2.0 capture walk-in family traffic with zero learning curve — the volume engine that sustains weekday baseline revenue while group attractions drive the weekend peaks.
In the Changsha store, the immersive theater category ranks #1 by play count — proof that a balanced mix of skill-free cinema and skill-based arenas outperforms any single-category lineup. This product-mix logic is the same framework we use in our commercial VR device rating comparison.
VR Market Analysis — Size, Regions, and What It Means for You
A practical vr market analysis starts with one question: is the commercial segment growing, and where? Industry market sizing published by Statista confirms sustained growth in the VR market overall — but the growth that matters to B2B operators is in location-based entertainment (LBE) VR. After the post-COVID return to out-of-home entertainment, the demand for shared, physical, social VR experiences has surged in ways that home headsets cannot satisfy.
Regionally, the vr in business opportunity is broad: established markets in North America and Europe are upgrading from single-attraction venues to full product matrices, while Southeast Asia, the Middle East, and Latin America are building new VR entertainment destinations from scratch. LEKE VR’s 40+ country deployment footprint reflects exactly this spread — from shopping-mall FECs to standalone Urban Entertainment Hubs.
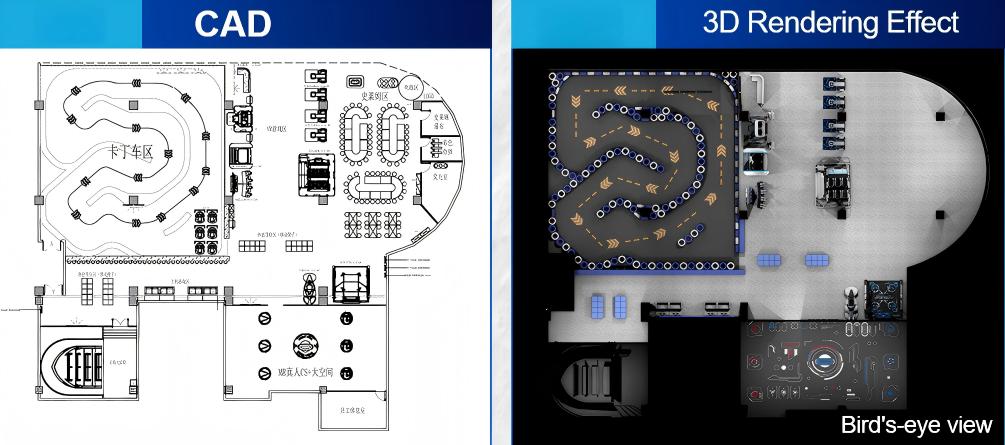
The most credible evidence in any vr market analysis is a working venue. LEKE VR’s Changsha flagship store — a real shopping-mall VR business opened May 2026 — has averaged approximately $8,000 in daily revenue through its early operations, validating that the five trends above translate into measurable income when executed as a full product matrix. Read the full VR Entertainment Business Case Study for the venue details.
B2B ROI Reference Model
Sample Monthly Revenue Model — 4-Attraction Configuration
A curated four-attraction lineup: 360° VR Chair · Space Shuttle 2.0 · Corps Pro · AR Sniper. Daily ticket assumptions: Mon–Thu 40, Fri 80, Sat–Sun 150 (4-week month).
| Monthly Metric | @ €10 / ticket | @ €15 / ticket |
|---|---|---|
| Monthly turnover | €21,600 | €32,400 |
| Fixed costs (staff + rent + misc.) | €15,000 | €15,000 |
| Monthly profit | €6,600 | €17,400 |
Fixed costs: 3 employees €6,000 + rent €6,500 + miscellaneous €2,500 = €15,000 / month.
Modeling example based on a typical European urban venue. Actual results vary by location, foot traffic, and local pricing. Use this as a starting point for your own vr market analysis — never as a guarantee.
How to Turn VR Industry Trends into a B2B Buying Decision
Knowing the trends is not the same as knowing your move. Here is how to translate these five vr industry trends into a concrete virtual reality b2b buying decision for your venue.
Free-roam multiplayer (Trend 2) delivers the highest per-session tickets. If your venue targets groups, this is your anchor. MR karting (Trend 1) is the strongest spectator draw for organic marketing.
Premium cinema (Trend 5) captures walk-in families with zero skill barrier, sustaining baseline revenue between group bookings — the volume half of the revenue equation.
Ask how new titles are delivered (Trend 3) and how AI fills solo/off-peak sessions (Trend 4). A supplier without a structured update pipeline sells hardware that decays within 12 months.
Use the 4-attraction reference model above with your local pricing, rent, and labor. Then apply our VR equipment cost-effectiveness framework to compare proposals on equal terms.
Turn These VR Industry Trends into Your Venue Plan
The five trends and the ROI reference model above are designed to be applied — not just read. If you are evaluating virtual reality b2b equipment for a specific venue, our solutions team can build a tailored equipment mix, 3D venue layout, and revenue projection around your floor plan and local market. Every inquiry includes technical documentation, venue case studies, and a free custom CAD floor plan.
Chat on WhatsApp — Plan Your Venue Mix
WhatsApp: +86-153 6087 7766 | Email: [email protected] | Response: 1 Business Day (GMT+8) | Footprint: 12-Year Factory · 40+ Countries · 700+ Venues
Frequently Asked Questions