

How do I evaluate the cost-effectiveness of VR equipment? If you are sourcing vr arcade equipment for a new venue, upgrading a fleet of commercial vr equipment, or building a business case for investors, you have likely encountered a frustrating reality: every supplier’s proposal looks different. One quotes a lower hardware price but has annual content license fees. Another includes content but charges a franchise royalty on your gross revenue. A third appears expensive upfront but bundles maintenance, spare parts, and software updates. Comparing these proposals by invoice price alone is like comparing cars by the cost of their tires. You need a framework that captures the full picture.
This article provides that framework. It does not tell you which best vr equipment to buy. It gives you a reusable methodology — a 5-layer cost model, a 4-variable revenue model, a 7-question supplier checklist, and a complete calculation walkthrough — that you can apply to any vr equipment proposal from any manufacturer. At the end, you will not have a recommendation. You will have a spreadsheet. And that is more useful.
What “Cost-Effective” Actually Means in Commercial VR
The most common mistake in vr equipment evaluation is treating cost-effectiveness as a synonym for “cheap.” It is not. A commercial vr equipment purchase is a revenue-generating asset, not a consumable expense. The correct metric is not the invoice price. It is the cost-effectiveness ratio:
Cost-Effectiveness Ratio = 3-Year Total Revenue Generated ÷ 3-Year Total Cost of Ownership
A piece of vr arcade equipment that costs $40,000 and generates $250,000 in revenue over three years has a C-E ratio of 6.25 — every dollar spent returned $6.25. A machine that costs $18,000 but generates only $60,000 in the same period has a C-E ratio of 3.33. The cheaper machine is less cost-effective. Price is the denominator. Revenue over time is the numerator. Both must be calculated across the same time horizon — three years is the industry-standard window because most commercial VR hardware is designed for a 3-5 year operational lifespan before major refurbishment or replacement.
This article is structured to help you populate both sides of that equation accurately — not with industry averages, but with numbers specific to your venue type, your customer demographic, and your local market conditions.
The 5-Layer True Cost Model — What You’re Actually Paying For
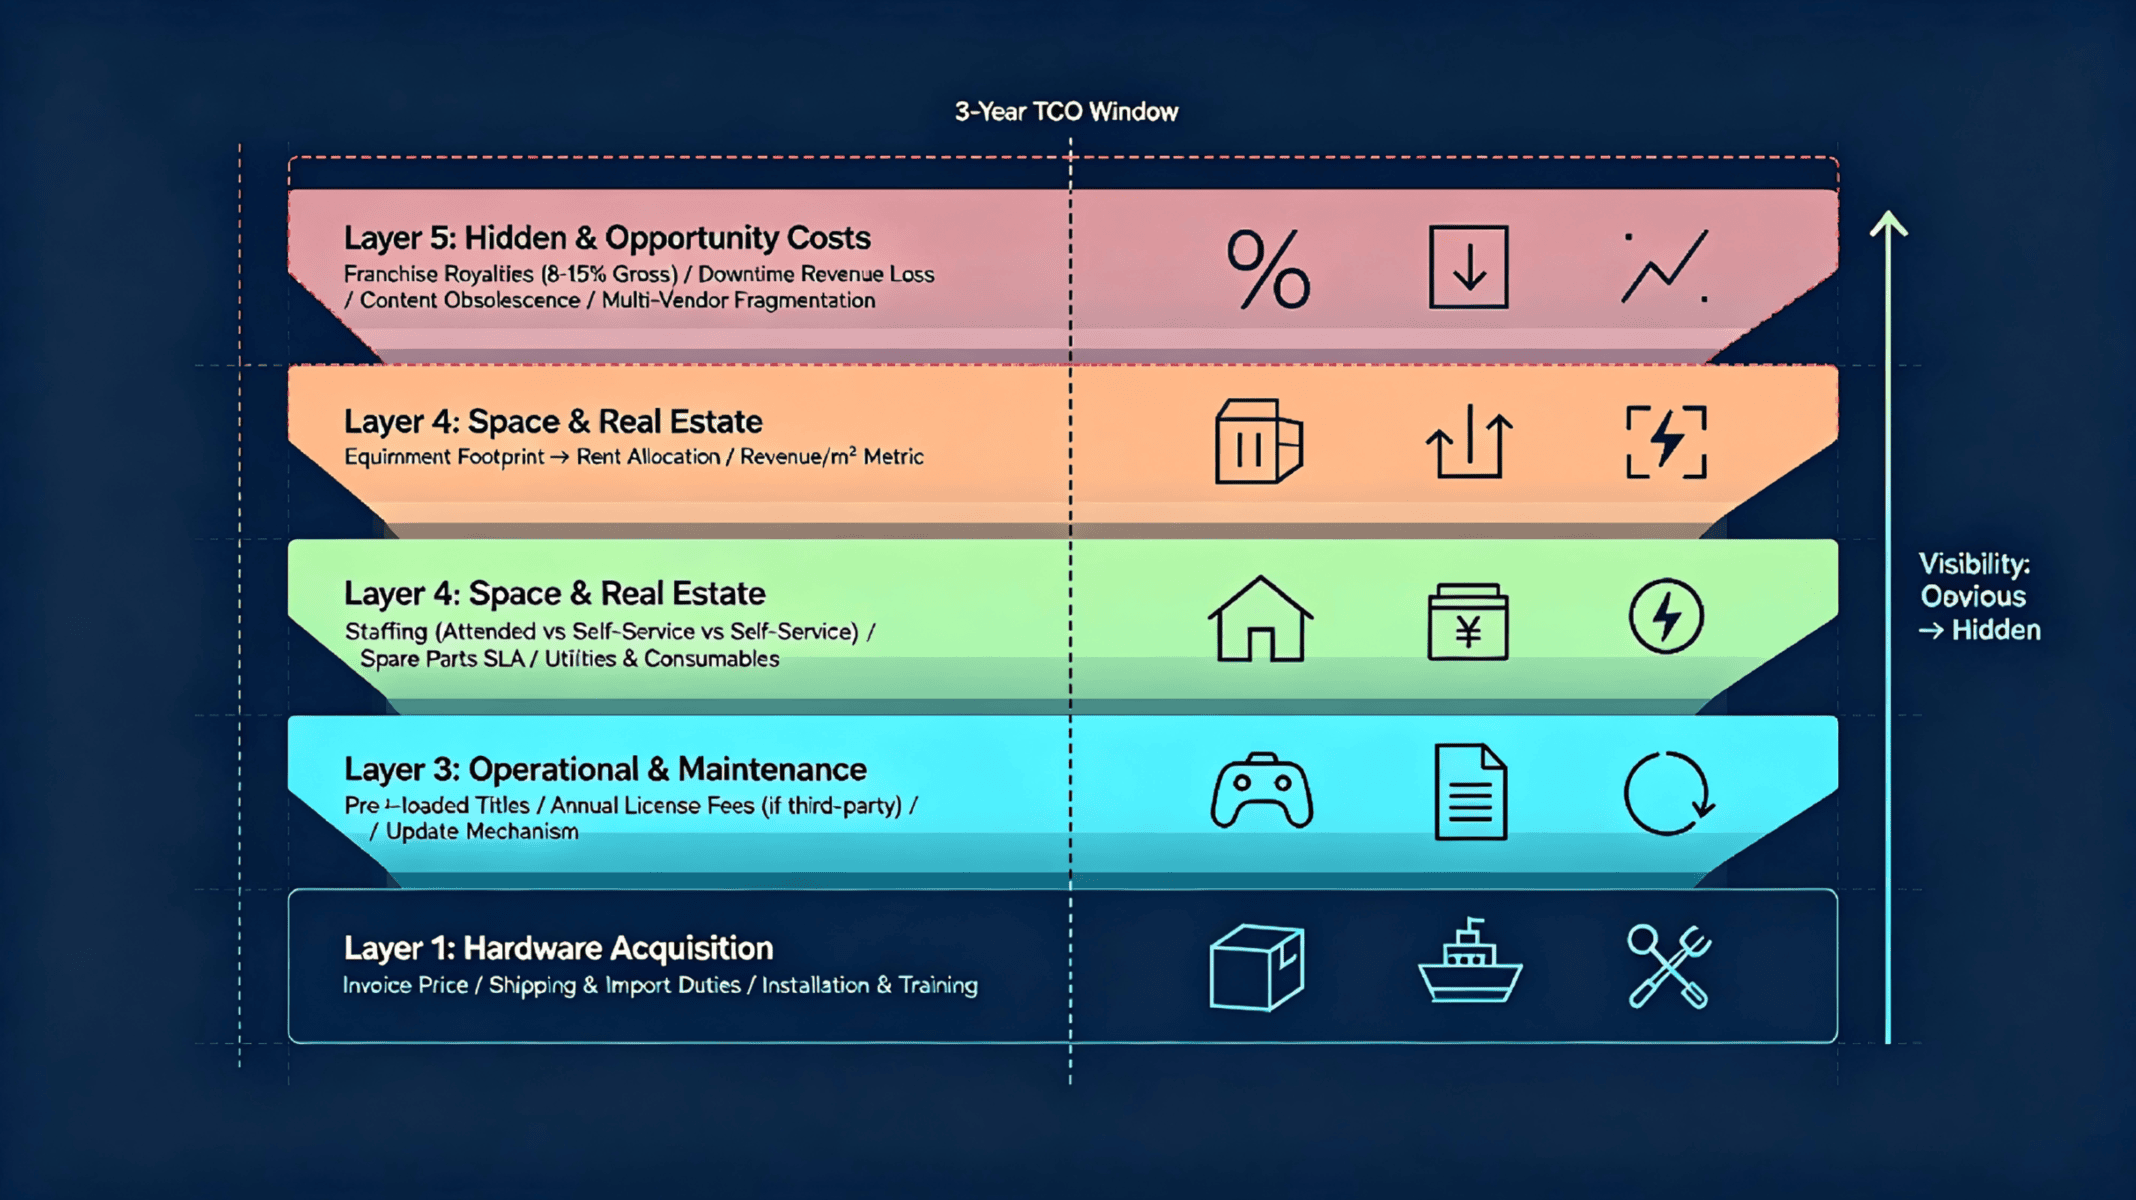
Commercial VR equipment cost is not a single number. It is five layers, arranged from most visible to least visible — and the less visible the layer, the larger its impact on long-term profitability. The model below works for any ar vr equipment type, from cinema pods to free-roam arenas to self-service kiosks.
Hardware Acquisition Cost — The Invoice
This is the number every buyer compares first — and the number that tells you the least about total cost. It should include: the base equipment unit(s), VR headsets (quantity and model specified), motion platforms or tracking infrastructure, controllers and accessories, initial spare parts kit, and any on-site installation and calibration service. For international buyers, this layer also includes shipping, freight insurance, import duties, and customs clearance fees — which can add 8-18% to the factory price depending on destination country and equipment weight. When comparing proposals, insist on a line-item breakdown of this layer. Two suppliers who both quote “$35,000” may have materially different inclusions. One may include headsets; the other may not. One may include installation; the other may charge it separately. The only way to compare is to make the inclusions identical and recalculate.
Content & Software Cost — The Recurring Charge Many Buyers Miss
VR hardware without content is a chair. The question is how you pay for the software that makes the hardware earn. The industry operates on two models. Model A (Bundled): a library of pre-loaded titles is included with the hardware purchase, and new titles are added over time as part of the equipment purchase — no separate annual fee. Model B (Licensed): the hardware ships with a starter library, but continued access to the full catalog — and any new titles released after purchase — requires an annual content license fee, typically calculated as a percentage of the original hardware price or a fixed annual subscription. Over three years, Model B can add 20-35% to the effective hardware cost. Before signing any purchase agreement, ask the supplier to itemize: (a) how many titles are included at delivery, (b) whether new titles released in years 2 and 3 are included or require additional payment, and (c) whether the content license is perpetual or requires annual renewal. If the supplier cannot produce a written content fee schedule covering the full expected equipment lifespan, treat the content layer as an unquantified liability in your cost model.
Operational & Maintenance Cost — The Daily Run Rate
Every hour a machine operates, it consumes resources. Staffing is the largest operational cost — and it varies dramatically by equipment type. A free-roam arena typically requires 1-2 dedicated attendants per session. A self-service VR kiosk requires zero. A cinema pod may require one staff member to oversee 2-3 pods simultaneously. Calculate staff cost as: hourly wage × operating hours per day × operating days per year × number of staff required. Spare parts and consumables are the next line item. High-wear components (headset face cushions, controller batteries, motion platform bearings, cable harnesses) have predictable replacement cycles. Ask the supplier for a recommended spare parts list with expected replacement intervals, and price those parts at retail. After-sales support responsiveness has a direct cost: a machine that is down for 48 hours waiting for a support ticket to be answered loses two peak-revenue days. Ask every supplier: “What is your guaranteed response time for a critical-failure support request on a Saturday at 7 PM?” The answer directly affects your revenue model’s uptime assumption. Electricity costs are typically modest for VR equipment (most units draw 1.5-5 kW during operation) but should be modeled for completeness.
Space & Real Estate Cost — Rent Allocated to Equipment
Every square meter of venue space costs rent. Allocate it to equipment proportionally. A cinema pod occupying 5.59 sqm in a venue renting at $30/sqm/month incurs approximately $168/month in space cost — roughly $2,000/year. A free-roam arena occupying 50 sqm at the same rate incurs $1,500/month — $18,000/year. These numbers are not trivial when modeled across a three-year window. The metric to optimize is revenue per square meter per month. A self-service kiosk at 2.46 sqm generating $1,200/month delivers $488/sqm/month — higher than a cinema pod at $350/sqm/month, even though the pod generates more absolute revenue. The equipment with the highest absolute revenue is not necessarily the most cost-effective. The equipment with the highest revenue per unit of cost — including space cost — is.
Hidden & Opportunity Costs — What You Don’t See Until Year Two
This layer contains the costs that do not appear on any invoice but determine whether the equipment is profitable or a write-off. Franchise royalties: some VR equipment suppliers operate on a franchise model, extracting 8-15% of the venue’s gross revenue as ongoing royalties. For a venue generating $400,000/year, that is $32,000-$60,000 per year — not for equipment, not for content, but for the right to operate under a brand name. Model this as a percentage of your projected gross revenue across the three-year window and add it to your cost model. Downtime revenue loss: a machine that fails on a Saturday afternoon and is not repaired until Tuesday has lost approximately 15-20% of its weekly revenue. If this happens twice per year, the annualized revenue loss can equal 3-5% of the machine’s theoretical maximum. Factor the supplier’s after-sales responsiveness into your uptime assumption. Content obsolescence: a machine whose content library never changes will see its repeat visitation rate decline steadily — approximately 15-25% per year after year one. This means the machine’s revenue in year three may be significantly lower than year one, even if the machine is operating perfectly. Content freshness is a revenue-preservation investment, not an optional feature. Multi-vendor fragmentation: if your venue sources equipment from three different suppliers, you manage three support hotlines, three warranty terms, and three parts supply chains. The administrative overhead — and the finger-pointing when a system integration issue arises — is a real operational cost.
The Revenue Side — 4 Variables That Determine Your Return
Cost is only half of the cost-effectiveness equation. The other half — the revenue the equipment generates — is driven by four variables. Understanding the typical range of each variable for each equipment type allows you to build a venue-specific revenue projection rather than relying on supplier-provided “average ROI” claims, which are rarely adjusted for your specific conditions.
How many people walk past the equipment location per day? This is venue-specific, not equipment-specific. A cinema pod in a shopping-mall food court may see 3,000+ daily passersby. The same pod in a resort hotel lobby may see 200. Use actual footfall data from your venue or comparable venues in your market. Do not use the supplier’s “typical mall traffic” number — get your own.
What percentage of passersby stop and become paying customers? This is highly equipment-dependent. An MR kart with visible physical motion converts at 5-8% of passersby. A free-roam arena with players visibly running and shooting converts at 4-6%. A 9D cinema pod with enclosed cockpit converts at 3-5%. A self-service kiosk with no external motion converts at 1-3%. Spectator visibility is the single largest driver of conversion rate — and it varies dramatically by equipment type. When evaluating conversion, consider the specific placement within your venue. An arena placed in a rear zone with no passersby has a conversion rate of zero regardless of its inherent draw.
What each paying customer spends per session. Typical ranges in developed markets: self-service kiosk $3-8, 9D cinema pod $5-12, racing/driving simulator $8-18, free-roam arena $15-35 per player, MR karting $15-30 per session. These ranges assume standard operating markets; adjust for your local purchasing power, competitive landscape, and venue positioning. Premium venues (theme parks, destination resorts) can price at the top of or above these ranges. High-competition urban retail locations may need to price at the lower end.
How many complete sessions can the equipment process per hour at steady-state operation? This depends on session duration plus turnaround time (cleaning, next-player onboarding). A 5-minute cinema session with 1-minute turnaround processes 10 sessions/hour × number of seats. An 8-minute racing session with 2-minute turnaround processes 6 sessions/hour per unit. A 15-minute arena experience with 5-minute briefing and turnaround processes 3 sessions/hour — but each session contains 10 players, so effective throughput is 30 player-sessions per hour. Always calculate throughput in player-sessions, not machine-sessions, when comparing equipment with different player capacities.
The Revenue Formula
Daily Revenue = Foot Traffic × Conversion Rate × Average Ticket × Throughput (player-sessions/hour) × Operating Hours
Worked Example: A cinema pod placed in a mall with 2,500 daily passersby, 4% conversion, $8 average ticket, 10 sessions/hour (2 seats × 5 sessions/hour each), operating 10 hours/day = 2,500 × 0.04 × $8 × 100 × 10? Check your units. Correct: 2,500 passersby × 4% conversion = 100 players/day. 100 players × $8 = $800/day. Annualized (350 operating days): $280,000 projected gross revenue. This number is the numerator in your cost-effectiveness ratio — and it is only as accurate as the four input variables.
Cost-Effectiveness by Equipment Type — Where Each Category Stands
The five-layer cost model and four-variable revenue model produce different cost-effectiveness profiles for each type of commercial vr equipment. Below is a qualitative assessment of where each category stands on the key cost-effectiveness drivers. Use this as a comparative reference, not as a substitute for your own venue-specific calculation.
HW Cost: ★ = lowest in category, ★★★★★ = highest. Content Risk “Verify” = ask supplier for written fee schedule covering years 1-3. Conversion and ticket ranges are industry-observed estimates for developed markets; adjust for your local conditions. “Best Fit” is the venue type where this equipment type typically achieves its strongest cost-effectiveness ratio.
The Mix Advantage
The most cost-effective venues rarely deploy a single equipment type. A layered configuration — for example, a premium arena (high ticket, high per-slot revenue) plus cinema pods (broad demographic coverage, steady throughput) plus self-service kiosks (zero-staff idle-space monetization) — produces a blended cost-effectiveness ratio that outperforms any single type alone. The arena generates the highest absolute revenue. The cinema pods sustain weekday baseline utilization. The kiosks convert dead space into incremental income. No single machine carries the full venue’s revenue burden. When modeling cost-effectiveness, calculate both per-machine C-E ratios and a blended venue-level C-E ratio.
The 7-Question Supplier Checklist — Red Flags That Reveal Hidden Costs
The five-layer cost model identifies what to calculate. The seven questions below identify what suppliers may not have volunteered. Ask every one of these before signing any equipment purchase agreement.
If the answer is “there are no additional fees,” ask for that in writing. If the answer references “annual content subscription” or “license renewal,” request the fee schedule for the full expected equipment lifespan. A supplier who cannot produce a multi-year content fee document is either unprepared to serve commercial operators or deliberately keeping this cost opaque.
Ask this question verbatim. Some suppliers describe royalties as “brand support fees,” “marketing levies,” or “system access charges.” The specific term does not matter. The percentage does. Even a seemingly modest 5% royalty on a venue generating $400,000/year is $20,000 per year — $60,000 across your three-year cost model. That is real money, and it must be in your calculation.
The specificity of this question matters. “We have a support hotline” is not an answer. “A dedicated engineer will respond via video call within 2 hours” is. The difference in downtime between these two answers — and therefore the difference in your annualized revenue assumption — can be 3-5% of the machine’s theoretical maximum. Multiply that across three years.
If new content requires a USB drive shipped from the factory — or worse, an on-site technician visit — the effective update cadence is zero for practical purposes. Content that is not updated is content that does not drive repeat visitation. This question directly affects your revenue assumption for year two and beyond. A venue with a static content library will see its repeat visitation rate decline approximately 15-25% annually. Model this into your revenue projection for any supplier who cannot demonstrate remote content delivery capability.
VR equipment models are updated, and older models may have components that become difficult to source. A supplier who says “we always have parts” without a written SLA is not providing a guarantee. Request a written spare parts availability commitment covering at least three years from purchase date, with specified lead times for critical components (headsets, motion platform actuators, tracking sensors, main controller boards).
Managing three different equipment suppliers for one venue means three support hotlines, three warranty terms, three parts supply chains, and three vendors each pointing at the others when a system integration issue arises. Single-supplier accountability eliminates this administrative overhead entirely. When calculating your venue’s total cost of ownership, include an estimate of the management hours required to coordinate multiple vendors — these hours have an opportunity cost.
For international buyers, these certifications are not marketing badges. They are documented prerequisites for customs clearance, commercial landlord approval, and public-liability insurance coverage. Equipment without valid certifications may be held at port, rejected by your landlord’s facilities team, or excluded from your insurance policy — all of which represent unplanned costs. Request the actual certificate PDFs, not a statement that the equipment “meets standards.” Verify issue dates and certificate numbers.
Sample Calculation Walkthrough — A Mid-Size FEC
To make the framework concrete, here is a simplified cost-effectiveness calculation for a hypothetical mid-size family entertainment center deploying a mixed equipment configuration. All numbers are illustrative — substitute your own.
Equipment Configuration
Simplified 3-Year Cost-Effectiveness Calculation
Cost Side (3-Year TCO): Hardware acquisition (all units, including headsets) + content fees (verify annual schedule) + staffing (3 FTE × annual wage × 3 years) + space cost (69.5 sqm total × monthly rent × 36 months) + spare parts (estimated at ~5% of HW cost/year) + electricity (~$2,500/year for all units) + contingency (10% of subtotal for unplanned repairs and replacement consumables). For this configuration in a typical developed-market urban location: approximately $350,000-$500,000 total three-year cost, depending on specific equipment models, local labor rates, and rent levels.
Revenue Side (3-Year Projection): Arena: 3 sessions/hour × 10 players × $25 avg ticket × 8 peak hours/day × 150 peak days/year + reduced off-peak rates = ~$180,000-$250,000/year. Cinema pods: 2 pods × 8 sessions/hour × 2 seats × $8 avg ticket × 10 hours/day × 350 days = ~$180,000/year. Kiosks: 3 kiosks × variable usage × $5 avg ticket × 12 hours/day × 350 days = ~$50,000-$80,000/year. Total annual gross: ~$410,000-$510,000. Three-year gross: ~$1.23M-$1.53M.
Cost-Effectiveness Ratio: Using midpoints — $425,000 three-year TCO, $1.38M three-year revenue → C-E Ratio = 3.25. Every dollar of total cost returns $3.25 in revenue across the three-year window. The blended payback period (time to recover the initial hardware investment from operating profit) is approximately 12-18 months, depending on ramp-up assumptions. This is a simplified illustration. Your venue’s actual numbers will differ. The point is not the specific output — it is the structure of the calculation. You now have a template. Replace every number with your own.
Apply This Framework to Your Venue
The 5-layer cost model, 4-variable revenue model, and 7-question checklist above are designed to be used — not just read. If you are evaluating commercial vr equipment for a specific venue and want to walk through a customized calculation using your actual floor dimensions, foot traffic data, and local market conditions, the next step is a direct conversation.
Chat on WhatsApp — Discuss Your Venue’s Cost Model
WhatsApp: +86-153 6087 7766 | Email: [email protected] | Response: 1 Business Day (GMT+8)